Sure, having robust help desk software is a game-changer, but tracking your team’s performance? That’s where the real magic happens. Enter service desk KPIs, your go-to metrics for measuring efficiency, customer satisfaction, and overall support quality.
But here’s the catch: Which KPIs actually matter? With an avalanche of help desk metrics out there, figuring out which ones deserve your attention can feel like searching for a needle in a digital haystack.
Now, let’s be real, metrics aren’t everything. Numbers can’t always tell the full story or explain the help desk metrics “why” behind a dip or spike. But what they can do is offer sharp insights into existing challenges and even give you a heads-up about potential roadblocks down the line.
So, if you’re on a mission to pinpoint the most impactful service desk metrics that’ll make your IT team look like absolute rockstars, buckle up because you’re in the right place.
Let’s dive in!
What Are Help Desk Metrics, and Why Do They Matter?
Help desk metrics are key performance indicators (KPIs) that measure how effectively your support team operates. These metrics provide clear, quantifiable insights into whether your team is hitting its targets and delivering top-notch customer support.
Now, while the core purpose of a help desk usually revolves around IT support, its scope often stretches beyond that. In many organizations, the help desk acts as a hub for customer service, support, or advocacy initiatives, essentially becoming the frontline for problem-solving and relationship-building.
The specific IT service desk metrics you track will depend on your team’s unique goals and the kind of support you deliver. Whether it’s IT troubleshooting, product-related queries, or general customer care, these metrics act as your guiding compass to improve help desk performance, boost satisfaction, and keep operations running smoothly.
IT Help Desk Metrics vs. KPIs: What’s the Difference?
While they might seem interchangeable, help desk metrics and Key Performance Indicators (KPIs) serve distinct purposes in measuring support team performance.
Think of it this way: Metrics are the building blocks, while KPIs are the end goal. For instance, a high Ticket Resolution Rate and low Average Response Time (metrics) contribute to achieving a broader KPI, such as improving customer satisfaction scores for the quarter.
In short, metrics feed into KPIs, and together they create a roadmap for continuous improvement and business success.
Why Are Proper Help Desk Metrics Essential?
In the world of IT Service Management (ITSM), metrics aren’t just numbers on a dashboard—they’re your window into real-world performance. IT isn’t the place for vague assumptions; you need clear, actionable data to guide your decisions.
Well-chosen IT service desk metrics provide concrete insights into whether your support processes are running smoothly or if something’s starting to wobble. These numbers become the foundation for informed business and management decisions.
Some of the key IT help desk performance metrics you’ll want to keep an eye on include:
A noticeable dip in any of these metrics is a red flag. It signals something isn’t quite right, whether it’s a training issue, a workflow bottleneck, or outdated systems.
From there, the next steps are clear: Diagnose the problem. Identify the cause. Implement solutions.
Bottom line? Service desk metrics keep your operations grounded, measurable, and ready for continuous improvement.
5 Benefits of Tracking Help Desk Performance Metrics
Tracking help desk KPIs offers several benefits that drive better performance and improve support team operations. Here’s how:
While tracking KPIs is essential, Tuva IT helps enhance these efforts by automating workflows and integrating seamlessly with your existing tools like ServiceNow, Jira, and Zendesk, increasing the effectiveness of your team’s work.
Related read: Why Help Desk Metrics Tracking Can’t Be Ignored?
15 Help Desk Metrics to Measure IT Support Performance
Tracking the right IT help desk metrics is crucial for ensuring your support team operates efficiently and effectively. But here’s the thing, not every metric is equally valuable to every organization.
The golden rule? Focus on the metrics that align with your organization’s goals and bring the most actionable insights.
If you’re just getting started with IT support performance tracking, the best approach is to categorize your help desk metrics. Generally, they fall into four main groups:
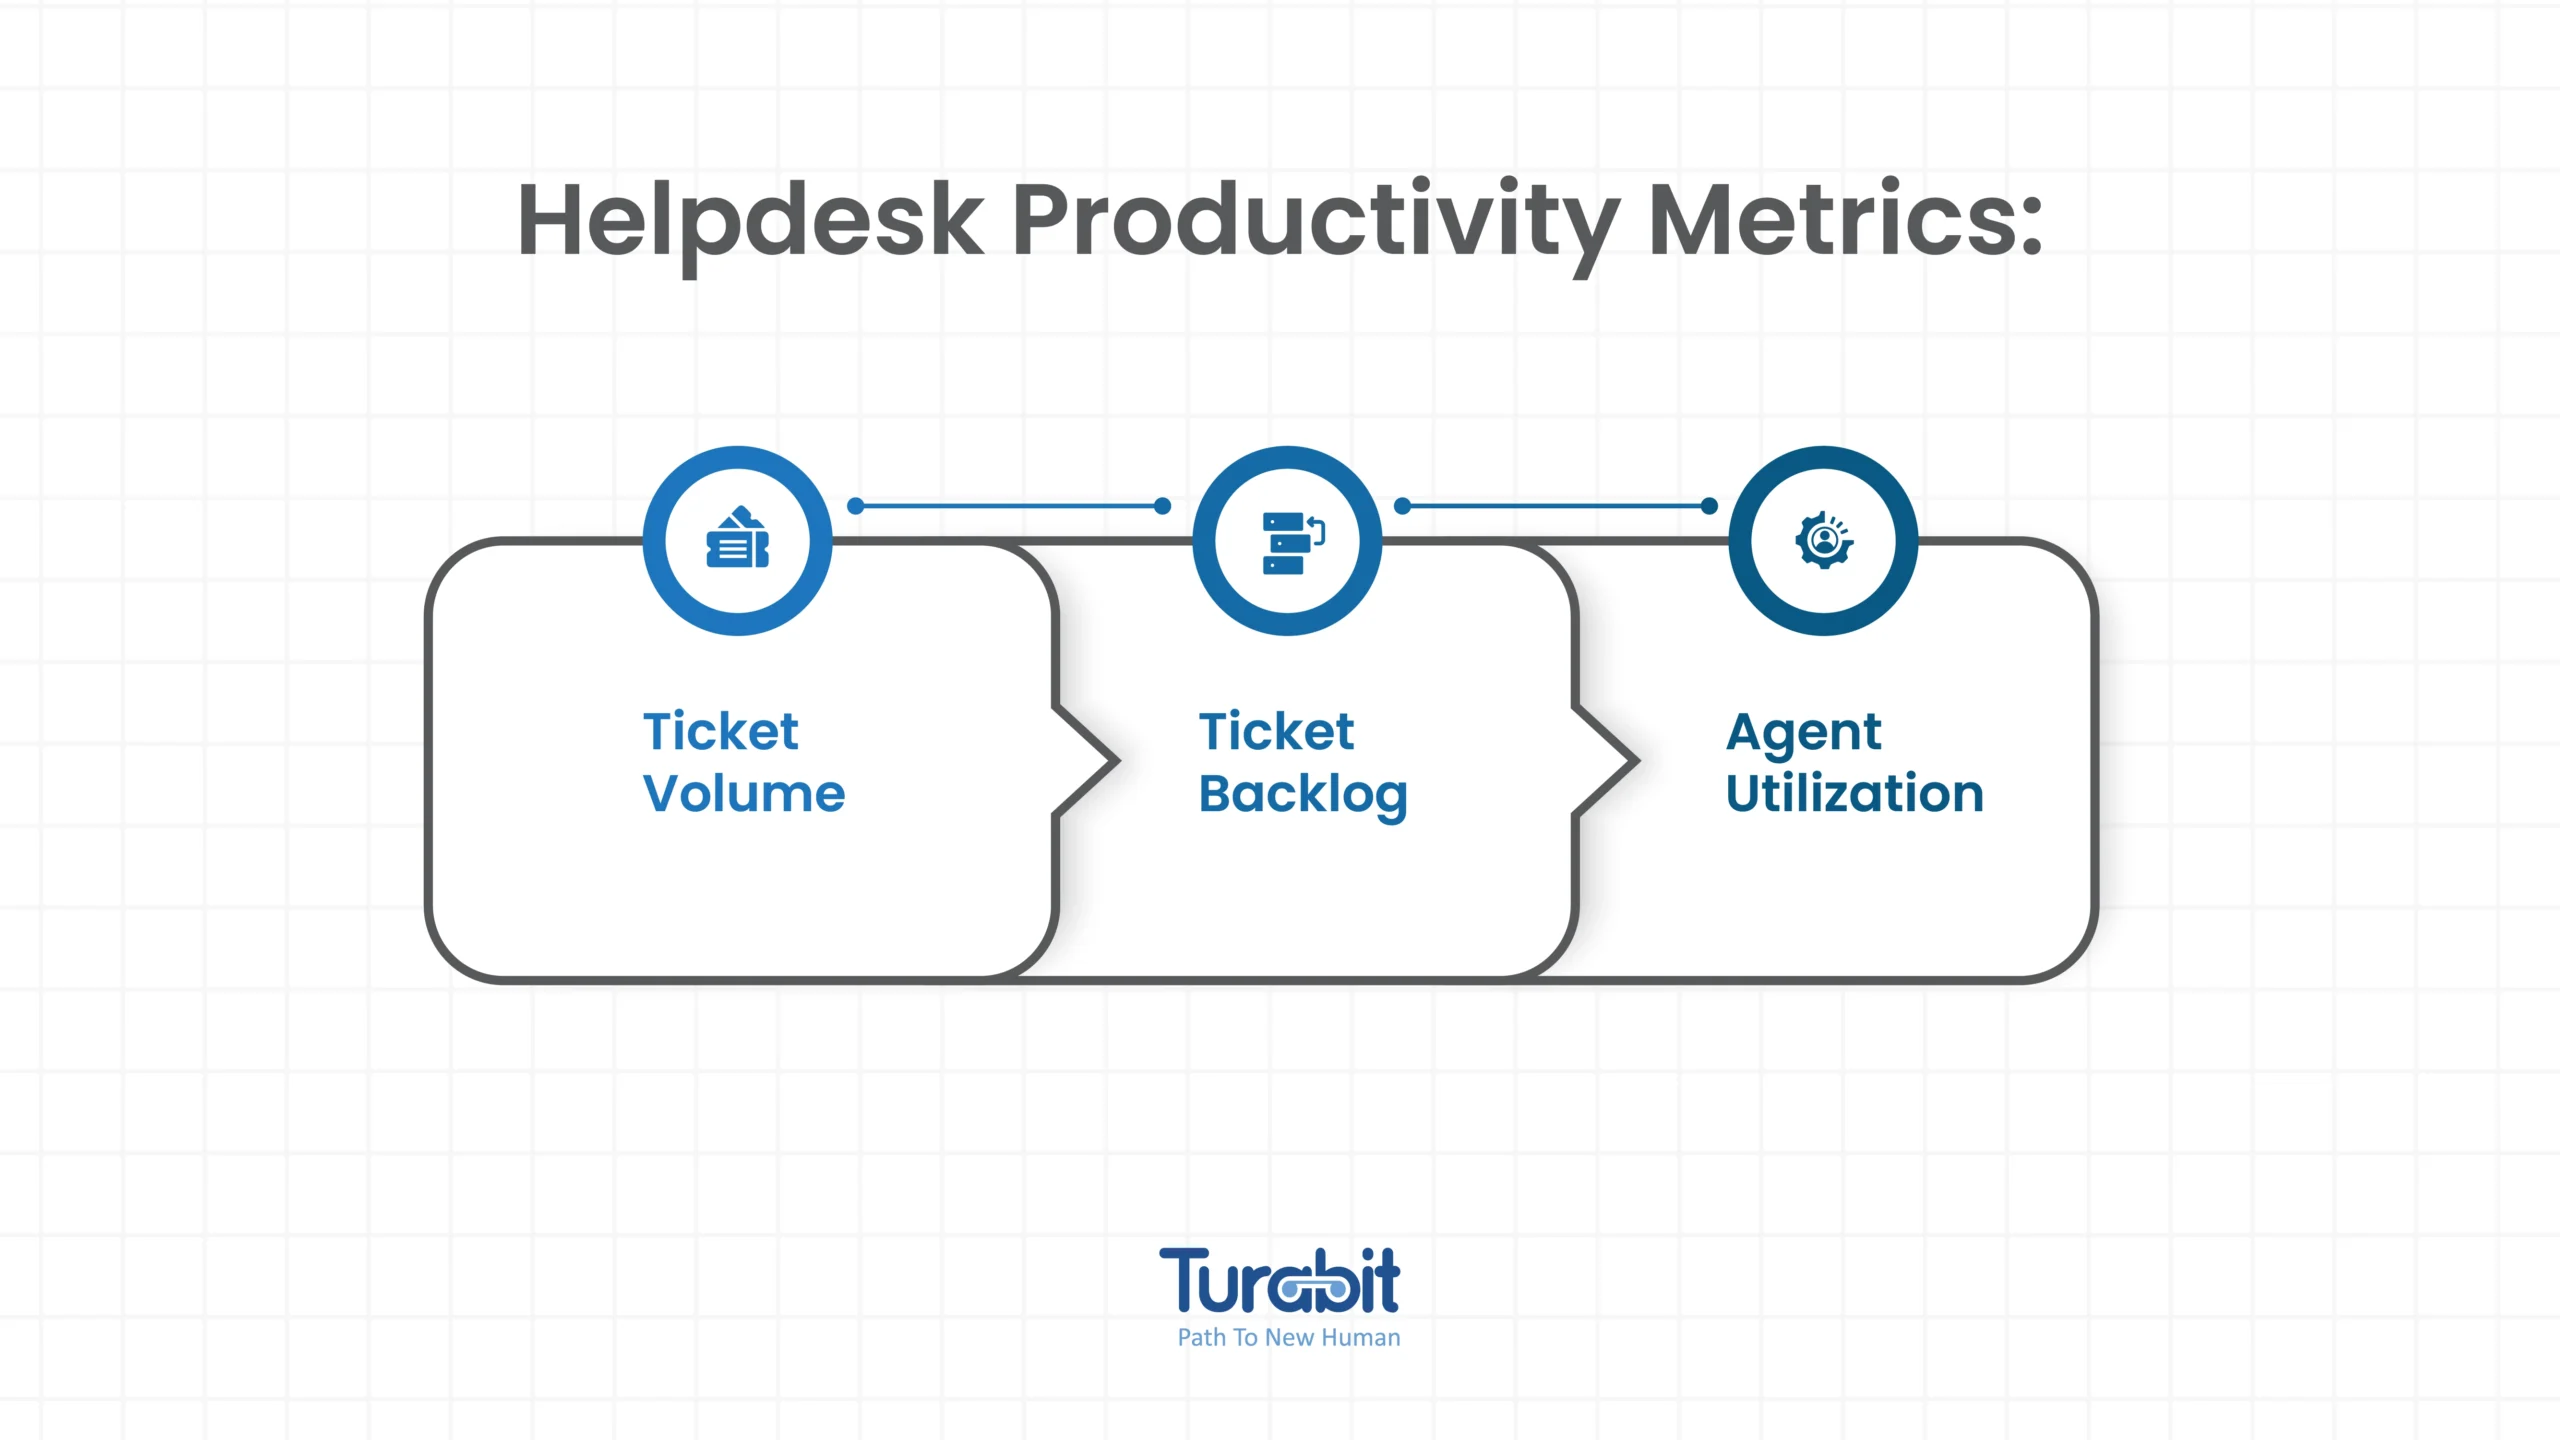
1. Productivity Metrics:
These measure the workload and efficiency of your IT support team or individual agents.
Key examples include:
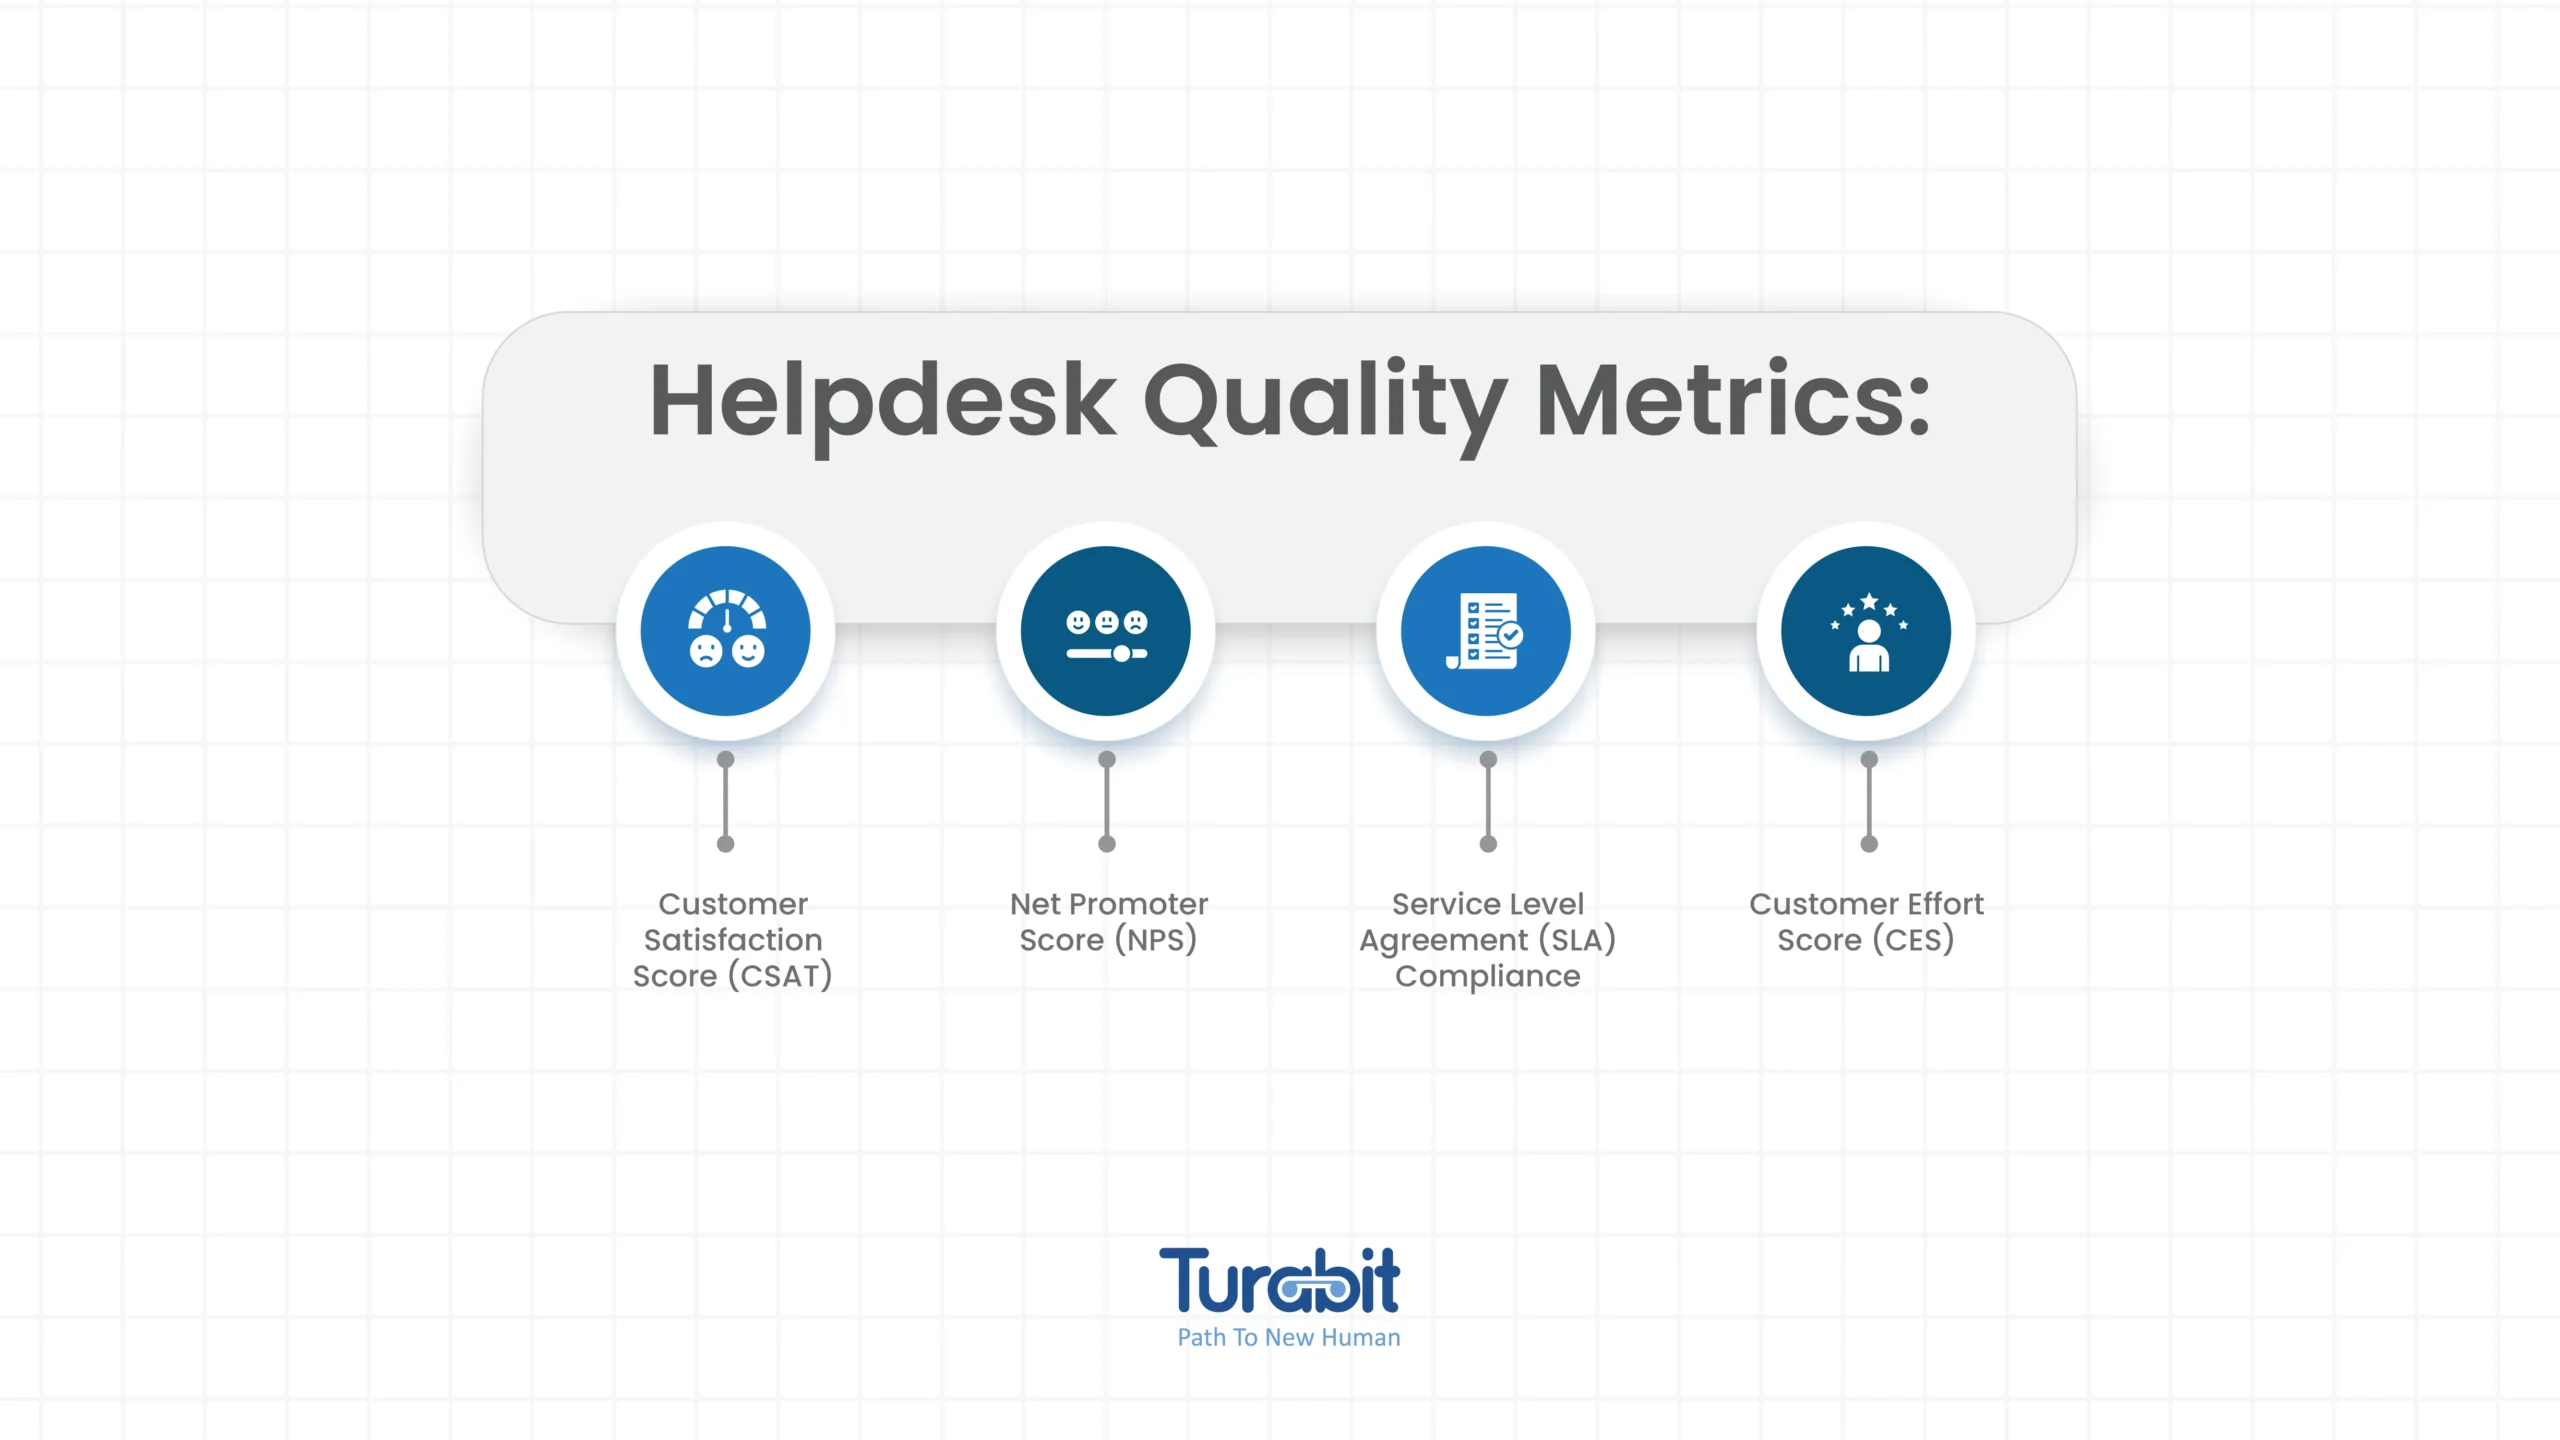
2. Quality Metrics:
These focus on the customer experience and how your support team impacts overall satisfaction. Look out for:
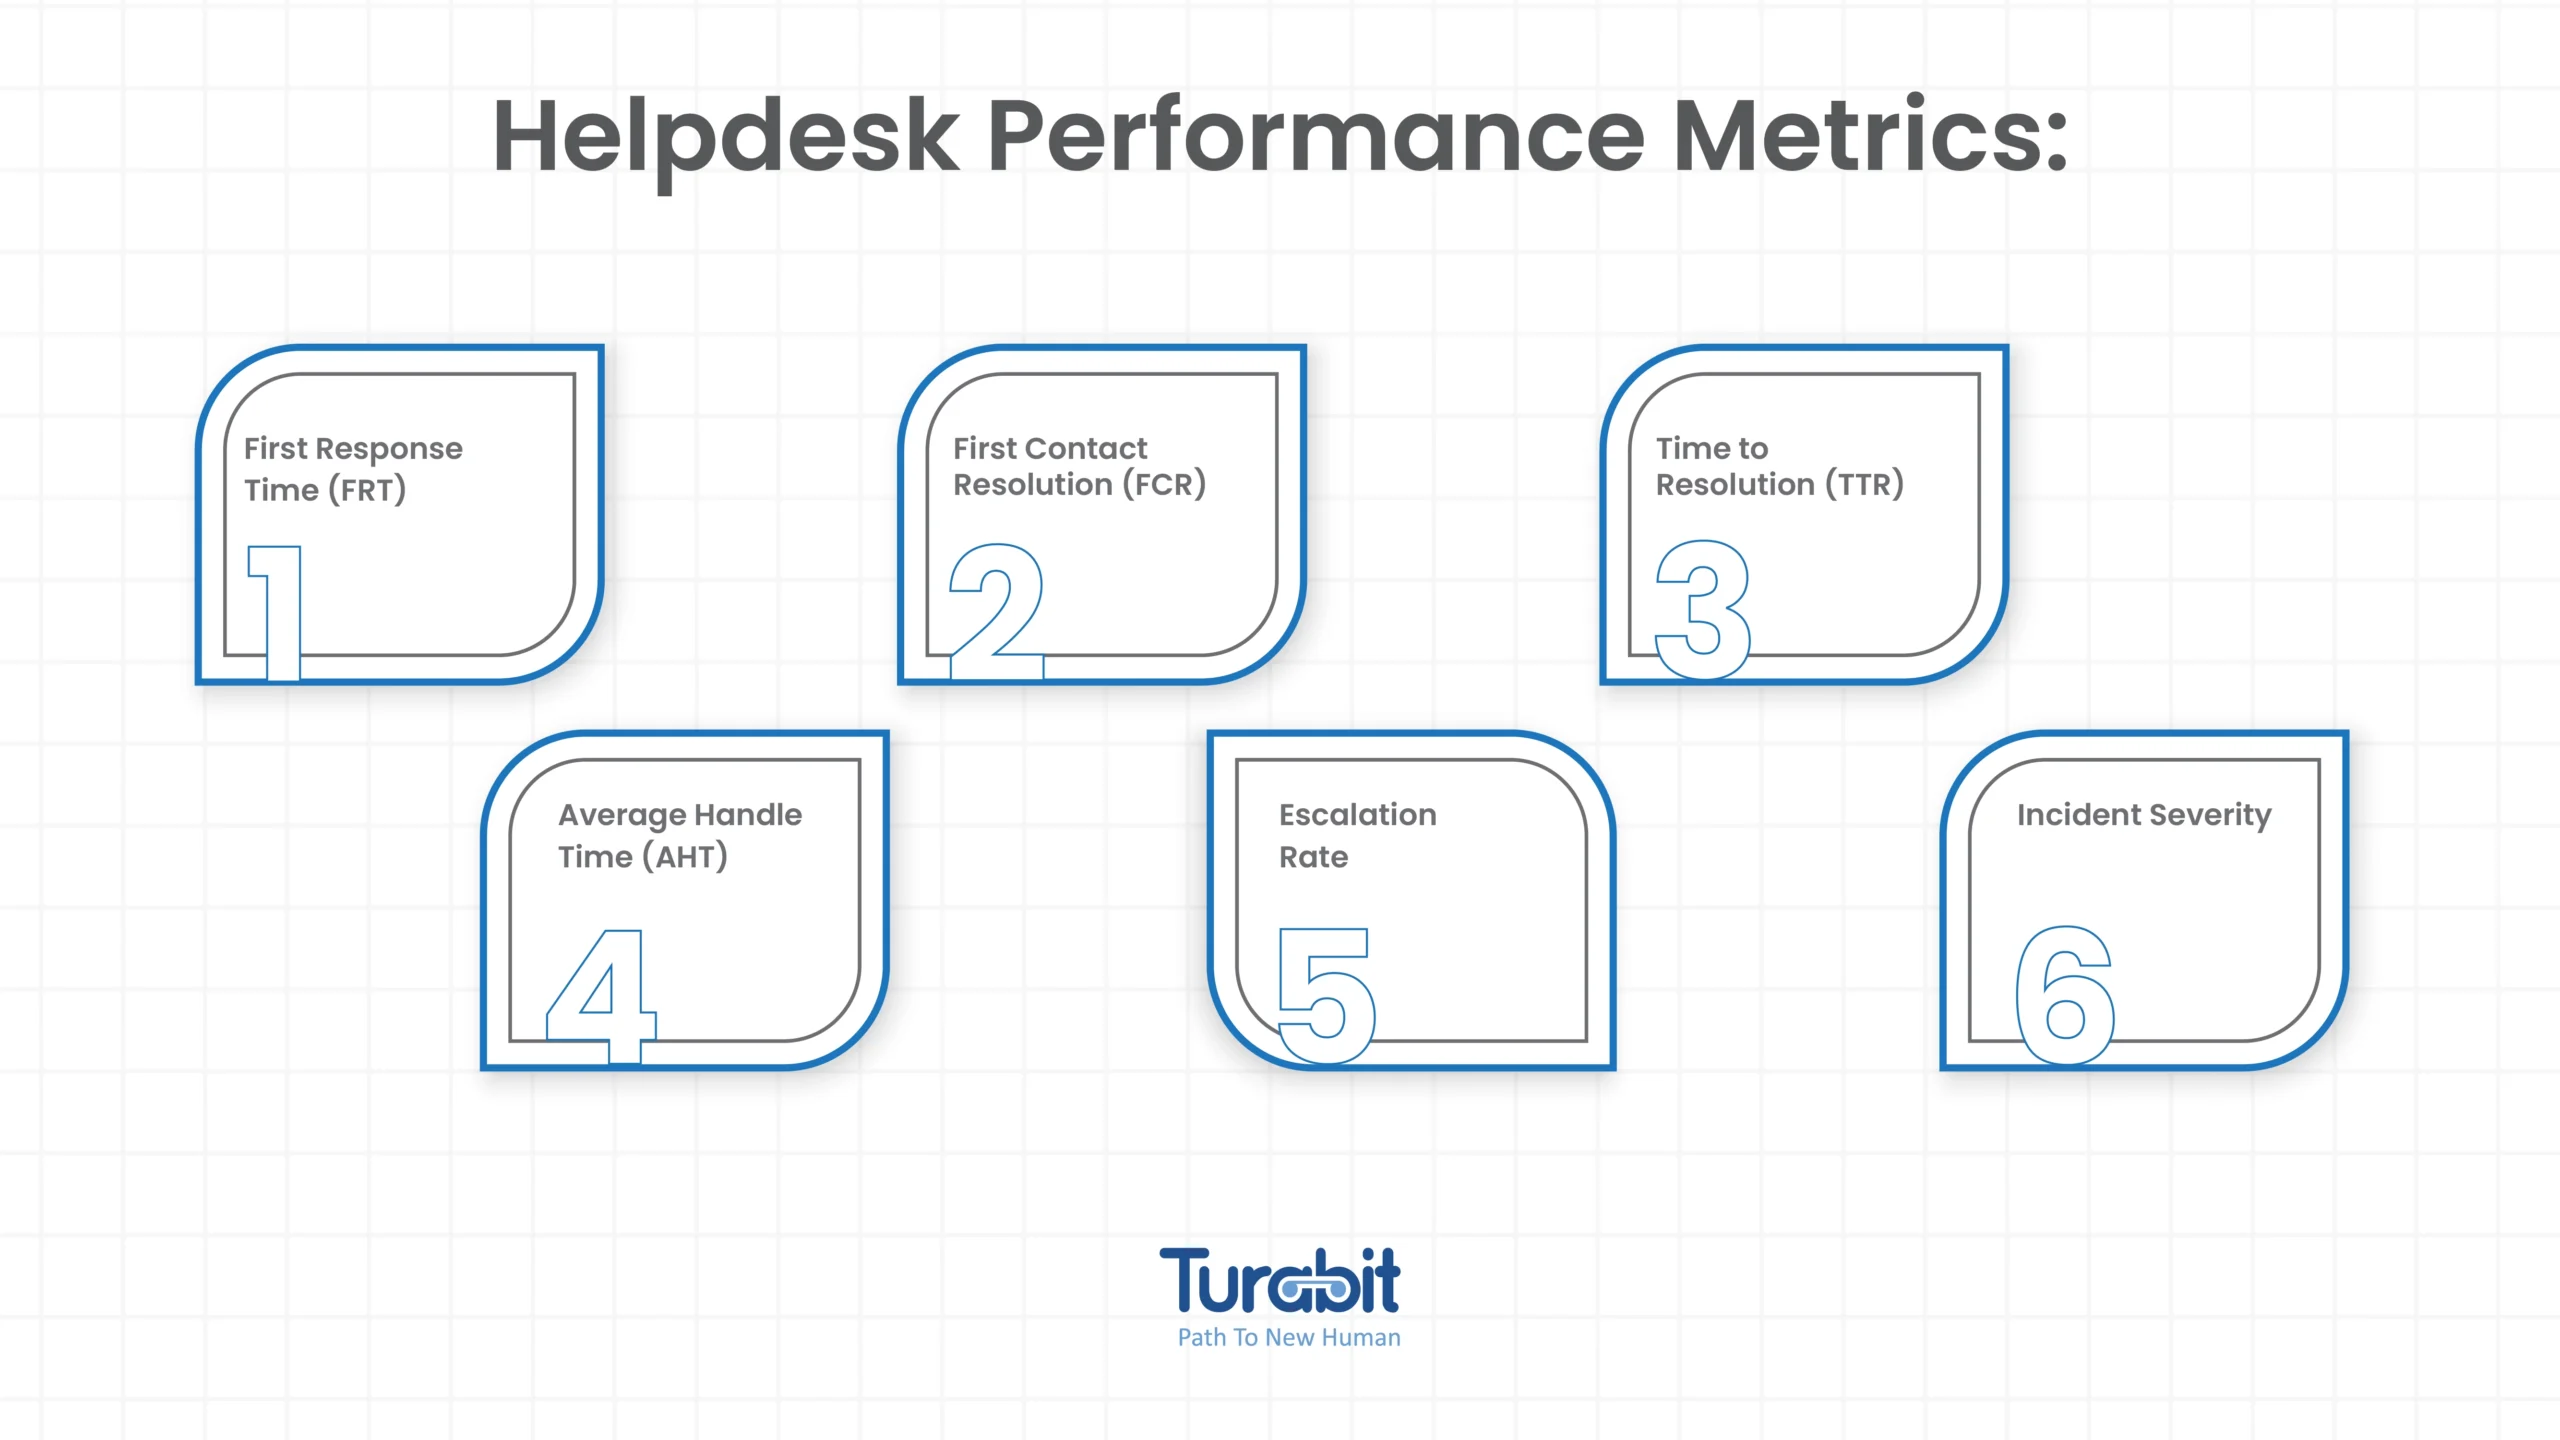
3. Performance Metrics:
IT help desk performance metrics evaluate how quickly and effectively your team resolves issues. Important ones include:
4. Financial Metrics:
These track the cost-effectiveness and ROI of your support operations. Examples are:
When you group your IT help desk metrics this way, you’ll gain a clear view of your team’s strengths, weaknesses, and areas for improvement. These insights aren’t just about numbers, they’re about creating a roadmap for smarter decisions and continuous growth.
Productivity Metrics:

1. Ticket Volume
Ticket Volume refers to the total number of incidents or requests that the IT support team processes over a set period. This metric offers a direct glimpse into your team’s workload and overall efficiency.
For instance, if Ticket Volume is consistently high, it could be a sign that your team might need additional resources to keep up, or it could point to systemic issues that are generating more tickets than usual. Either way, it’s an essential metric for understanding how well your team is managing the support load.
2. Ticket Backlog
Ticket Backlog represents the number of unresolved tickets within a specific time frame. It reflects your team’s workload, efficiency, and impact on customer satisfaction.
A high backlog suggests that your team might be overwhelmed, causing delays and frustration for customers. Conversely, a low backlog indicates efficiency, faster resolutions, and happier customers.
Formula:
Ticket Backlog = (Number of Open Tickets at Start) − (Number of Resolved Tickets)
If you start the week with 50 open tickets and resolve 30, your backlog is: 50 – 30 = 20
Monitoring and addressing Ticket Backlog ensures smoother operations and improved customer satisfaction.
3. Agent utilization
Agent Utilization measures the percentage of an IT support agent’s available time spent on support-related tasks. It highlights whether resources are being used efficiently or stretched too thin.
Formula:
Agent Utilization (%) = (Total time spent on support tasks ÷ Total available work hours) × 100
Balancing agent utilization ensures teams remain productive without sacrificing well-being or output quality.
Related read: Are You Tracking Help Desk Productivity Metrics?
Quality metrics:

1. Customer Satisfaction Score (CSAT)
Customer Satisfaction Score (CSAT) gauges customer satisfaction with the IT support they receive. Typically measured through post-interaction surveys, customers rate their satisfaction on a scale of 1-5 or 1-10.
Why it matters: Regular CSAT tracking provides valuable insights into support quality and highlights areas needing improvement.
Formula: CSAT (%) = (Total number of satisfied customers ÷ Total number of survey responses) × 100
2. Net Promoter Score (NPS)
NPS is a key indicator of customer satisfaction, loyalty, and the overall brand perception.
How it works: Customers rate their likelihood to recommend on a scale of 0-10, categorizing them as:
Promoters (9-10): Loyal enthusiasts
Passives (7-8): Satisfied but unenthusiastic
Detractors (0-6): Unhappy customers
Formula:
NPS = Number of Promoters – Number of Detractors
3. Service Level Agreement (SLA)
Service Level Agreement (SLA) Compliance measures how effectively an IT support team meets the standards outlined in their SLA, such as response times and resolution deadlines.
SLA Compliance directly impacts customer satisfaction and loyalty. Meeting agreed-upon service standards builds trust and enhances the company’s reputation.
It tracks the percentage of tickets resolved within the promised timeframes, as outlined in the SLA, ensuring your team delivers as expected.
Formula:
SLA Compliance = (Requests Resolved within SLA / Total Requests) × 100
4. Customer Effort Score (CES)
Customer Effort Score (CES) measures how easy or difficult it is for a customer to resolve an issue or complete a transaction with a support team.
CES highlights areas where customer experience can be improved, aiming for minimal effort from the customer.
After a support interaction, customers rate the effort required on a scale from “very easy” to “very difficult.”
Formula: CES = (Total Effort Score / Total Responses)
Related read: Are You Tracking Help Desk Quality Metrics?
IT help desk Performance Metrics:

1. First Response Time (FRT)
First Response Time (FRT) measures how quickly an IT support team responds to a customer’s initial request for help.
A faster response usually leads to higher customer satisfaction and loyalty. FRT shows how responsive your team is, impacting customer satisfaction and retention. FRT tracks the time from when a customer submits a request to when the team first responds.
Formula:
FRT = Time of first response – Time of ticket creation
2. First Contact Resolution (FCR)
First Contact Resolution (FCR) measures the ability of an IT support team to resolve customer issues during the first interaction.
FCR directly impacts customer satisfaction and operational efficiency. Resolving issues at the first point of contact reduces wait times and improves customer loyalty.
To calculate FCR, divide the number of support requests resolved in the first contact by the total number of support requests, then multiply by 100 to get the percentage.
Formula:
FCR = (Number of Issues Resolved in First Contact / Total Number of Issues) x 100
3. Time to Resolution (TTR)
Time to Resolution (TTR) measures how long it takes for an IT support team to resolve a customer’s issue.
TTR directly impacts customer satisfaction; quicker resolutions lead to happier customers.
Calculate TTR by subtracting the time the request was made from the time it was resolved.
Formula:
TTR = Resolution Time – Request Time
4. Average Handle Time (AHT)
Average Handle Time (AHT) measures the average duration an IT support agent spends handling a customer request, including communication and related tasks.
AHT helps assess support team efficiency, but it must be balanced with metrics like Customer Satisfaction and First Contact Resolution to ensure quality service.
AHT includes not only the time spent with the customer but also any follow-up tasks like research and documentation.
Formula:
AHT = Total Talk Time + Total After-Call Work Time / Total Number of Calls
5. Escalation Rate
Escalation Rate measures the percentage of requests that are escalated to higher support or management levels when the initial support team is unable to resolve the issue.
A high escalation rate might indicate gaps in the support team’s ability to resolve issues, which can affect customer satisfaction and operational efficiency.
The rate is calculated by dividing the number of escalated requests by the total number of requests and multiplying by 100.
Formula:
Escalation Rate = (Number of Escalated Requests / Total Number of Requests) × 100
6. Incident Severity
Incident Severity measures the impact of IT incidents on an organization’s operations. It categorizes issues based on their level of disruption, helping to prioritize and resolve them effectively.
This helps businesses focus on the most critical issues first, reducing downtime and maintaining operations.
How it works: Incidents are classified into four severity levels:
No direct formula; severity is assessed based on the impact (number of users affected, system criticality) and urgency (time needed for resolution).
Critical and high incidents are prioritized to minimize disruption, while medium and low can be resolved within normal processes.
Related read: Are You Tracking Help Desk Performance Metrics?
Financial metrics:

1. Cost Per Ticket
Cost Per Ticket measures the average cost of resolving a support ticket and helps organizations gauge the financial impact of their IT support operations.
It helps businesses assess resource allocation and process efficiency. Track the total cost of support operations and divide it by the number of tickets resolved.
Formula: Cost Per Ticket = Total Support Costs / Number of Tickets Resolved
2. Return on Investment (ROI)
Return on Investment (ROI) measures the financial return from investments made in IT infrastructure, software, or technology-related projects.
ROI helps organizations evaluate the profitability and success of their investments, guiding future resource allocation decisions.
ROI is calculated by comparing the gain from an investment to its cost.
Formula: ROI = (Gain from Investment – Cost of Investment) / Cost of Investment x 100
Related read: Are You Tracking Help Desk Financial Metrics?
All in all
Alright, let’s wrap this up with a bang! When it comes to running an efficient IT support operation, keeping track of the right help desk metrics is absolutely key.
We’re talking everything from Ticket Volume to CSAT and NPS, each one gives you a crystal-clear snapshot of how things are running. Whether you’re checking how fast your team is responding or how satisfied your customers are, these metrics help you fine-tune your service and stay ahead of the game.
Now, don’t just look at these numbers in isolation, use ‘em to drive change, make smarter decisions, and keep your support operation running like a well-oiled machine.
If you want to really level up your IT service, tools like Tuva IT are a game changer. With AI-powered automation, you can speed up resolutions, increase efficiency, and still keep your customers grinning ear to ear.
It’s all about working smarter, not harder. So, get these metrics in your toolkit and watch your support team crush it every single time!

